February 2024 has been a big month for Google Analytics in Confluence. We've released our 5th major version of the app, with some major changes and enhancements that we think you'll love.
What's new?
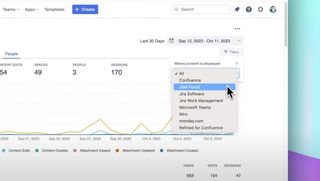
Filter control row
We've moved things around a bit. A consolidated filter controls row allows you to do filtering and date range selection all in one place. It's an improvement to the user experience that we think our customers will really appreciate.

Filter by user type
Staying within that filter control row, you can now filter reports on user type in Google Analytics in Confluence.
It removes the guesswork from understanding what your guest users are viewing and when.
This was a top feature request from Confluence users who share their content with external partners.
Guest users & public names
Guest users are now easily distinguished from normal users on all reports by the GUEST status on their avatar image.
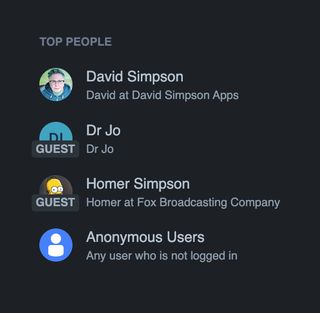
We've also added the "Public Name" as a subtitle below each person's "Display Name".
Filter by where displayed
Are you displaying your Confluence content in Jira Software, Jira Work Management, Jira Service Desk, or external tools like Refined or monday.com?
Google Analytics in Confluence reports can be filtered by where the content is displayed.
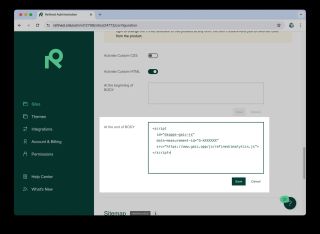
Deeper integration with Refined for Confluence
We've added full tracking support for Refined for Confluence whether you're using Confluence Embedded pages or standard Refined.
If you've using Confluence Embedded Pages with Refined, it will just work out of the box, otherwise setup is as simple as copy and pasting a script tag into Refined.
😎 Dark mode support
As you may have guessed from all the previous screenshots, Confluence dark mode is now fully supported.
It's simple to turn on and off:
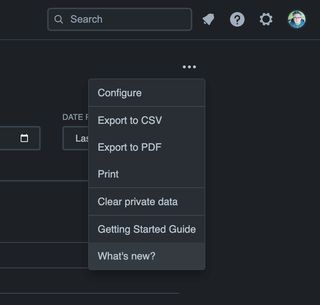
Links to documentation in the "•••" / Tools dropdown menu
Each screen now has menu items for documentation:
- Getting Started Guide, for new users to familiarise themselves with the interface
- What's new? links to the Changelog, so you can keep up with new features and enhancements
Group memberships displayed on the People tab
This is another feature request from current customers. Being able to see which groups people are members of really helps our customers understand how their users are consuming, and interacting with Confluence content.
Filtering results tables
We've added a Results Filter to top of all report table. This allows the table of results to be filtered by any text contained within the table. This filter is also used by the Export to CSV feature.
What's improved?
It's still the same Google Analytics in Confluence with simple and easy navigation between screens, but now things are just that little bit easier to see, use and navigate.
Date range selection
We’ve simplified the date range picker control into 3 much simpler to use controls rather than the large dropdown "mega menu" for date selection.
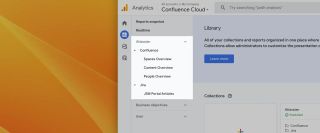
Links to "parent" screens
It's now even easier to get back to the "Analytics Overview" or "Space Analytics" screens from deeper within the reporting screens.
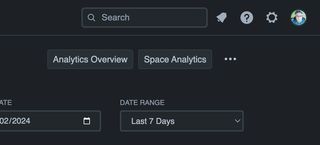
We've pulled the navigation out of dropdown menus so that there are fewer clicks required to get things done. It's a small improvement, but every click saved is time saved.
Conclusion
We've listened to our customers and brought new features such as the deep integration with Refined for Confluence Cloud and the user type filter.
We think that the updates will really make a difference in understanding how your internal and external users are interacting with, and consuming Confluence content – whether it's inside Confluence, Jira, Jira Work Management, Jira Service Desk, or in external systems such as Refined for Confluence, or monday.com.
Initial feedback from customers is good. An example:
Love what you have done!
Amazing how much has been enhanced since we spoke in January.
We continue to add other small improvements in between shipping larger new features.
If you're not already using it, we'd love you to try out the new version of Google Analytics in Confluence by starting a 30 day trial.
If you are a current customer or using the trial, you will automatically be updated to the new version.
Photo by Rachel Walker on Unsplash
