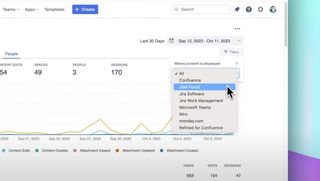
As the vendor of the Google Analytics in Confluence app — which allows you to track Atlassian Confluence usage in Google Analytics and then view reports within Confluence — we are often asked to extend the product to allow Google Analytics reports for external websites to be viewed within Confluence Cloud.
While we really like the idea of this, we have been somewhat reluctant to add this functionality because it would involve us as a company to store a user token (i.e. a representation of your user credentials) on our servers so that we can display the reports on your behalf. As a security conscious company, we have always resisted storing other people’s data in our services where possible.
We have found a solution to this problem which side-steps these security concerns. Google provides an excellent free service – Google Data Studio Looker Studio – which allows you to build reports based on many different data sources, and authorisation is handled by Google. One such data source is Google Analytics.
Introducing Looker Studio
Looker Studio allows you to quickly build custom reports for Google Analytics and share them as publicly or privately as you require. Our product Looker Studio in Confluence allows you to simply and easily embed these reports from Looker Studio within Confluence Cloud.
The video below shows you how to build a custom Google Analytics dashboard or report in Looker Studio and then embed that report within an Atlassian Confluence page using the new Google Data Studio Looker Studio in Confluence app.
We'd love you to try out Looker Studio in Confluence by starting a 30 day trial.
Video transcript
In this video you will find out how to build a custom Google Analytics report from scratch, in Looker Studio, and then embed that report within an Atlassian Confluence page.
Prerequisites
Before you begin, you will need the following:
- A Google Analytics account
- A Looker Studio account (likely the same as the Google Analytics account)
- An Atlassian Confluence Cloud subscription
- Looker Studio in Confluence installed on the Confluence Cloud instance
Enhance your workflows with David Simpson Apps
Discover powerful apps and integrations for monday.com, Atlassian, and Microsoft 365. Streamline processes, embed analytics, and boost collaboration.
Explore appsIn Looker Studio
Create a report
Create a Blank Report, then connect the report to Google Analytics, selecting your Account, Property and View.
Next, give the report a suitable name.
Set the canvas size
To nicely fit within the Confluence page, set a canvas size of around 800 pixels by 800 pixels and choose a theme for the report. You can change this later if necessary.
Add the elements to the report
With this done, place the various elements on the page and arrange them as required. A date range control is useful if you wish to look at different date ranges.
It is simple to add dimensions and metrics to build the perfect reporting features for your requirements.
A little layout adjustment can sometimes be necessary. Once you’re happy with the report, change to View mode to see how well it works.
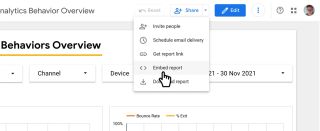
Share the report
Back in Edit mode, you can now Share the report, enable embedding and copy the Embed URL.
In Confluence
Over in Confluence, create a new page and paste the Embed URL.
A new Looker Studio macro will appear. Set the height of the macro, Publish the page and your new Google Analytics report is now available within Confluence.
This article is part of our complete guide to Google Analytics in Confluence.