New product released
Today we have released a new app on the Atlassian Marketplace – BI Dashboards in Confluence 💃
It allows you to effortlessly embed content from all your favourite cloud-based analytics, business intelligence & data science providers within Confluence.
Supported providers
Right now, there's support for 15 providers including Datapane, Datawrapper, Geckoboard, GoodData, Looker Studio, Holistics, Knowi, Looker, Metabase Cloud, Mode Analytics, Microsoft Power BI, Qlik, Sigma, Tableau and Trevor.io.
If your favourite tool is not supported, then let us know and we'll look into it.
Supporting business users
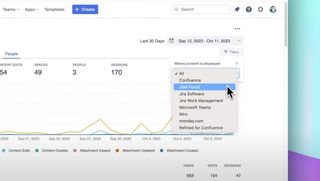
BI Dashboards in Confluence is designed to support business users, allowing them to make better everyday decisions based upon data. It enables self-service analysis in a seamless experience for users within an organisation.
Users can quickly ask questions of their data and uncover meaningful insights without having to leave Confluence. Users can take advantage of self-service tools such as data visualisations, interactive dashboards, and reporting to turn insights into action.
Enhance your workflows with David Simpson Apps
Discover powerful apps and integrations for monday.com, Atlassian, and Microsoft 365. Streamline processes, embed analytics, and boost collaboration.
Explore appsBusiness Intelligence where the users need it
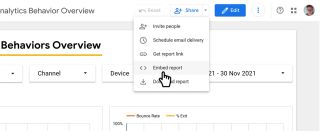
By embedding reports and dashboards directly within Confluence, users will find the insights they need seamlessly, without the need for context switching.
This can give increased adoption of all the BI tools in your organisation and lead to better decisions as a result of the insights found by your users.
Ad-hoc Reporting
By embedding self-service reporting within Confluence, businesses allow users to discover their own answers using a familiar interface.
Users of any skill level should be able to build and share their own reports, dashboards, and visualisations.
We'd love you to try out BI Dashboards in Confluence by starting a 30 day trial.
Update: See the latest release.